
Understanding EtG Half-Life: Why Your Body Doesn’t Clear Alcohol Markers in a Straight Line
Most people picture alcohol leaving their system like sand draining from an hourglass — steady, constant, predictable. EtG half-life doesn’t work that way at all, and understanding why is the difference between reading your results correctly and badly misjudging your timeline.
Think about how a hot cup of coffee cools on your desk. It doesn’t lose heat at a fixed number of degrees per minute — it drops fast at first, then slower and slower as it approaches room temperature. Ethyl glucuronide behaves the same way in your body. That pattern is called exponential decay, and half-life is simply the name for how quickly it happens.
The Core Idea, Without the Jargon
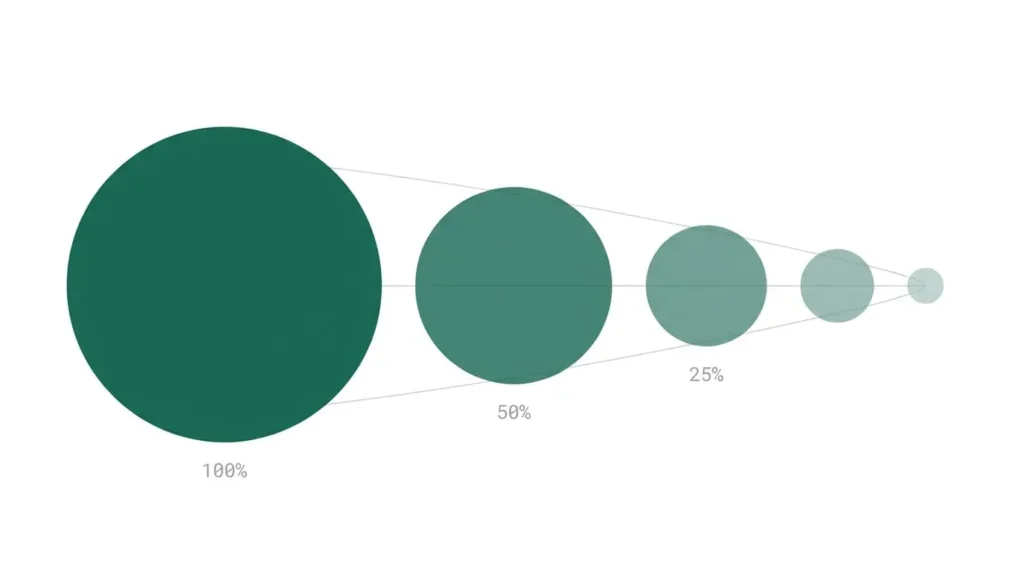
Half-life is the amount of time it takes for a concentration to drop by exactly 50%, no matter how high or low it starts.
So if your body has an EtG concentration of 2,000 ng/mL and the half-life is 4 hours:
- After 4 hours → ~1,000 ng/mL
- After 8 hours → ~500 ng/mL
- After 12 hours → ~250 ng/mL
- After 16 hours → ~125 ng/mL
Notice something important: the drop in each step keeps shrinking (1,000 → 500 → 250 → 125), even though the percentage drop stays the same (50% every time). That’s why the last stretch before a level clears a cutoff can feel like it drags on — you’re chasing smaller and smaller decreases.
If you want to see this play out with your own numbers instead of a fixed example, our EtG Half-Life Calculator builds this exact curve based on your drinks, weight, and metabolic rate.
Where the Number Actually Comes From
EtG half-life isn’t a number someone picked arbitrarily — it comes from pharmacokinetic studies that track ethanol metabolites through the body over time. Researchers give volunteers a measured dose of alcohol, then sample blood or urine repeatedly over the following hours to chart the rise and fall.
One such study measured serum and urinary excretion kinetics of ethyl glucuronide after a medium alcohol dose and mapped out the full elimination curve from peak to clearance (Halter et al., 2007, International Journal of Legal Medicine). Broader reviews of EtG as a biomarker have similarly described it as a metabolite that clears predictably once absorption is complete, which is part of why it became a preferred marker over less consistent indicators (Wurst, Skipper & Weinmann, 2003, Addiction).
What these studies consistently show is that EtG behaves in a fairly orderly, dose-proportional way — which is exactly what makes half-life modeling a reasonable way to estimate its decline, even though no calculator can replace an actual measured sample.
Three Quick Scenarios
Numbers land better with context, so here’s how the same underlying half-life plays out differently depending on how much someone drank.
Scenario A — one drink, average metabolism. A single standard drink produces a relatively small EtG load. With an average ~3.75-hour half-life, the concentration can fall below a 100 ng/mL cutoff within roughly a day, though individual results vary.
Scenario B — four drinks over an evening, average metabolism. A larger dose means a higher starting point, so even with the same half-life, it takes proportionally longer to fall below the same cutoffs — often stretching well past 24 hours for the strictest thresholds.
Scenario C — four drinks, slower metabolism. Shift the half-life from 3.75 to 5 hours and the entire curve stretches out further, even though the starting dose didn’t change. This is the part people underestimate: two people who drank the exact same amount can clear at meaningfully different speeds.
This is precisely why a single “hours per drink” rule of thumb — the kind you’ll see repeated in forums — breaks down. Half-life and starting dose interact, and a calculator that models both is far more honest than a flat multiplier.
Common Misunderstandings About EtG Half-Life
“Half-life means it’s gone in double that time.” Not quite — because decay is exponential, a substance never technically reaches zero on a clean schedule. What matters practically is when it falls below a specific test cutoff, not when it hits absolute zero.
“Everyone has the same half-life.” No. Liver enzyme activity, genetics, hydration status, and overall metabolic health all shift where a person falls in the roughly 2.5–5 hour range reported in the research. That’s why our calculator lets you choose a slow, average, or fast setting instead of assuming one number fits everyone.
“Drinking water shortens the half-life.” Hydration can dilute a urine sample and lower the concentration a lab measures, but it doesn’t change the biological rate at which your liver clears EtG. These are two different things that are easy to conflate.
“A higher cutoff always means a shorter wait.” Generally true, but not by a fixed ratio — because of the shape of the curve, moving from a 500 ng/mL cutoff to a 100 ng/mL cutoff can add a disproportionately large amount of time, not just a small adjustment.
How This Plays Into Real Testing Programs
Half-life on its own is a biology concept. What actually matters to someone facing a test is how that curve intersects with the cutoff their specific program uses. Court-ordered monitoring and probation testing frequently use the strictest 100 ng/mL threshold, while some workplace programs use the less sensitive 500 ng/mL level — and the gap between those two, given the same half-life, can be substantial.
If you know which threshold applies to you, it’s worth checking your numbers directly:
And if you want the full picture rather than a single cutoff check, the Advanced ETG Calculator walks through more detailed inputs.
Frequently Asked Questions
Is EtG half-life the same in blood and urine? Research generally reports similar elimination behavior between blood and urine once absorption is complete, though urine concentrations are also affected by hydration and urine flow rate, which blood measurements aren’t.
Why do calculators give a range instead of one exact half-life? Because the published research itself reports a range — generally around 2.5 to 5 hours — driven by individual differences in liver enzyme activity and overall metabolism, not a single fixed constant.
Does body weight change your half-life? Body weight mainly affects your starting concentration (how much a given amount of alcohol raises your EtG level), rather than the rate at which that level then halves.
Can medications affect EtG half-life? Some medications that influence liver enzyme activity may plausibly affect metabolite clearance, though this is an area with less direct research specific to EtG. If you’re on medication and this matters for a real test, that’s a conversation for a healthcare provider, not a calculator.
Is there a way to speed up EtG half-life? No method has been shown to reliably accelerate the liver’s clearance of EtG. Claims about detox drinks or supplements shortening it aren’t supported by the pharmacokinetic research this field relies on.
Sources
- Halter CC, Dresen S, Auwaerter V, Wurst FM, Weinmann W. Kinetics in serum and urinary excretion of ethyl sulfate and ethyl glucuronide after medium dose ethanol intake. International Journal of Legal Medicine, 2007.
- Wurst FM, Skipper GE, Weinmann W. Ethyl glucuronide — the direct ethanol metabolite on the threshold from science to routine use. Addiction, 2003;98(Suppl 2):51–61.
- National Institute on Alcohol Abuse and Alcoholism (NIAAA)
- CDC Alcohol and Public Health
Try the Calculator
Ready to see your own curve instead of the examples above? Head to the EtG Half-Life Calculator and enter your drinks, weight, and metabolic rate.
More Guides
Educational content only. This article explains general pharmacokinetic concepts and does not constitute medical, legal, or professional advice. It cannot predict the outcome of any specific laboratory test. Consult a qualified healthcare professional or certified testing laboratory for anything that depends on an actual test result.